RAMBar: A macOS menu bar RAM monitor for developers
A native macOS menu bar app for tracking memory usage across Claude Code sessions, VS Code workspaces, Chrome tabs, and Python processes.
Visit project →Claude Opus 4.5 kept crashing my VS Code.
Nothing wrong with the model—it was just so good that I started running 5, 6, even a dozen Claude Code sessions at once. My 16GB MacBook Air couldn’t keep up. I upgraded to a 48GB MacBook Pro, which mostly solved the crashes, but I still had no visibility into what was eating memory. Activity Monitor shows processes, but not answers like “which Claude session is the hog?” or “can I spawn another subagent?”
So I built RAMBar—my first macOS app, built entirely with Claude Code. It shows RAM usage the way developers think about it.
What It Does
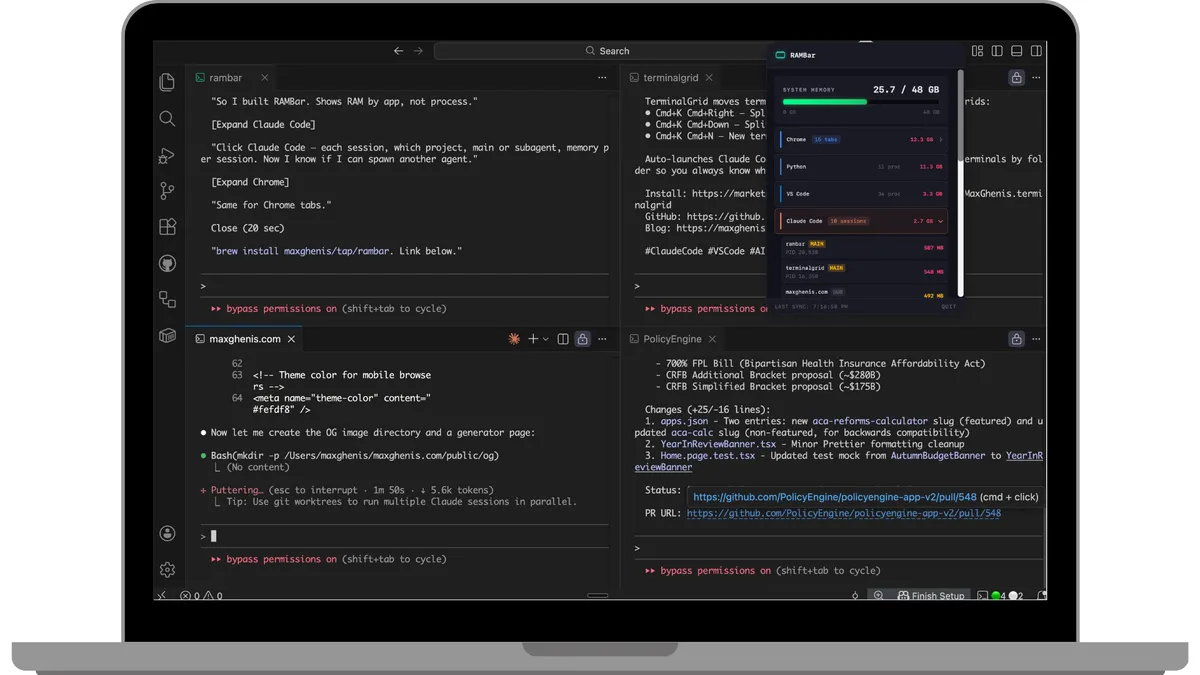
RAMBar lives in your menu bar showing current RAM percentage, color-coded by status:
- Green: Under 70%, you’re fine
- Yellow: 70-85%, getting tight
- Red: Over 85%, time to close something
Click it to see a breakdown of what’s actually using your memory.
Developer-Focused Breakdowns
Unlike generic system monitors, RAMBar understands developer workflows:
- Claude Code sessions — Shows main sessions vs subagents separately, so you can see when parallel agents are spawning
- VS Code workspaces — Memory grouped by which project folder is open
- Chrome tabs — Lists individual tabs by memory, so you can find that one tab eating 2GB
- Python processes — Useful when you’re running Jupyter notebooks or ML training alongside everything else
How it compares to other tools
Several macOS menu bar monitors exist, but none understand developer workflows:
| Tool | Price | Developer context | Claude Code awareness |
|---|---|---|---|
| RAMBar | Free | ✅ Groups by workspace/session | ✅ Shows sessions + subagents |
| Stats | Free | ❌ Process-level only | ❌ |
| iStat Menus | $12 | ❌ Process-level only | ❌ |
| MenuBar Stats | $5 | ❌ Process-level only | ❌ |
| Activity Monitor | Free | ❌ Process-level only | ❌ |
Stats is excellent for general system monitoring—CPU graphs, network throughput, disk I/O—and it’s free and open source. iStat Menus adds weather widgets, fan control, and extensive customization for $12.
RAMBar solves a different problem. When I see high memory usage, I don’t want to know that node is using 4GB—I want to know which VS Code workspace that node process belongs to. I don’t care that there are 47 Chrome Helper processes; I want to know which tab is the culprit. And when Claude Code spawns subagents, I want to see that hierarchy, not a flat list of identical claude processes.
If you need comprehensive system monitoring, use Stats or iStat Menus. If you’re an AI-assisted developer who wants to know why your Mac is struggling during a coding session, RAMBar fills that gap.
Get it
brew tap maxghenis/tap
brew install --cask rambarRequires macOS 14.0+. First launch: right-click and select Open to bypass Gatekeeper (the app is currently unsigned).
Part of 12 Days of Shipping.